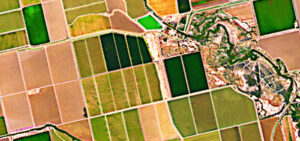
Global Agricultural Monitoring
GEOGLAM provides a framework which strengthens the international community’s capacity to produce and disseminate relevant, timely, and accurate consensus-based forecasts of agricultural production at national, regional, and global scales through the use of Earth Observations (EO), including satellite and ground-based observations. Under this framework, the GEOGLAM Crop Monitor was launched in 2013 as the flagship activity of GEOGLAM. The GEOGLAM Crop Monitors provide open, timely, and science driven information relating to crop conditions on a monthly basis for over 97% of global agriculture. These assessments are developed in partnership with the main agriculture and food security monitoring agencies globally, including over 70 partners from national, regional, and global monitoring systems, governments, space agencies, agricultural organizations and universities. This GEOGLAM activity is coordinated by researchers at the University of Maryland and NASA Harvest.
The monthly Crop Monitor assessments published across three separate bulletins outlined below reflect an international, multi-source, and consensus based assessment of crop growing conditions and agro-climatic factors likely to impact global production. This activity represents the first time that the international community has come together on a monthly basis to produce joint assessments. Since its launch in September 2013, Crop Monitor has grown extensively and has become an internationally recognized source of information on global crop prospects, a key indicator for SDG 2 Zero Hunger, and widely quoted by public and private agencies as well as top-tier media.

Crop Monitor for Agricultural Markets Information System (CM4AMIS)
The Crop Monitor for AMIS (CM4AMIS) was launched in 2013 in direct response to the GEOGLAM G20 policy mandate to support the Agricultural Market Information System (AMIS) with timely and transparent information on crop conditions for the major producing and exporting countries, covering the four primary global commodity crops: wheat, maize, rice, and soybeans. The first issue of the Crop Monitor appeared in the September 2013 publication of the AMIS Market Monitor.


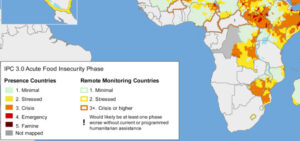
Crop Monitor for Early Warning (CM4EW)
Subsequently, building on the success of the Crop Monitor for AMIS and realizing the importance of timely and consensus-based assessments for countries at risk of crop production shortfalls, the Crop Monitor for Early Warning (CM4EW) for countries at risk of food insecurity was launched. Operational since February 2016, the CM4EW has become an internationally recognized source of reliable information on early warning and crop conditions and is often used to inform humanitarian organization decisions on food allocation and assistance.


Global Crop Monitor
Recognizing the trade interdependencies of the countries covered by the Crop Monitors for AMIS and Early Warning and the importance of understanding global crop conditions as a whole, in 2022 the Global Crop Monitor was launched, providing a synthesis of the global crop conditions by combining the information and assessments from the Crop Monitor for AMIS, the Crop Monitor for Early Warning, and from direct inputs from additional countries that don’t fall within the areas covered by the CM4AMIS or CM4EW.


The tabs below lead to more information on these monitoring reports and some of the many partner initiatives that provide support to them.


In addition to the monthly bulletins, the Crop Monitor coordination team has also launched several publicly available tools to facilitate global crop condition analysis, including the CMET and AGMET EO Indicator Tool outlined below.
The new and improved Crop Monitor Exploring Tool (CMET) provides users with comprehensive insights into global crop conditions. With interactive map formats, users can visually explore current in-season crop conditions and monthly changes for a user-defined crop type and time period, gaining valuable insights into crop health, yield potential, and regional variations. The tool also allows users to explore crop calendars, providing information regarding when specific regions and crops are entering the planting, development, and harvesting stages.
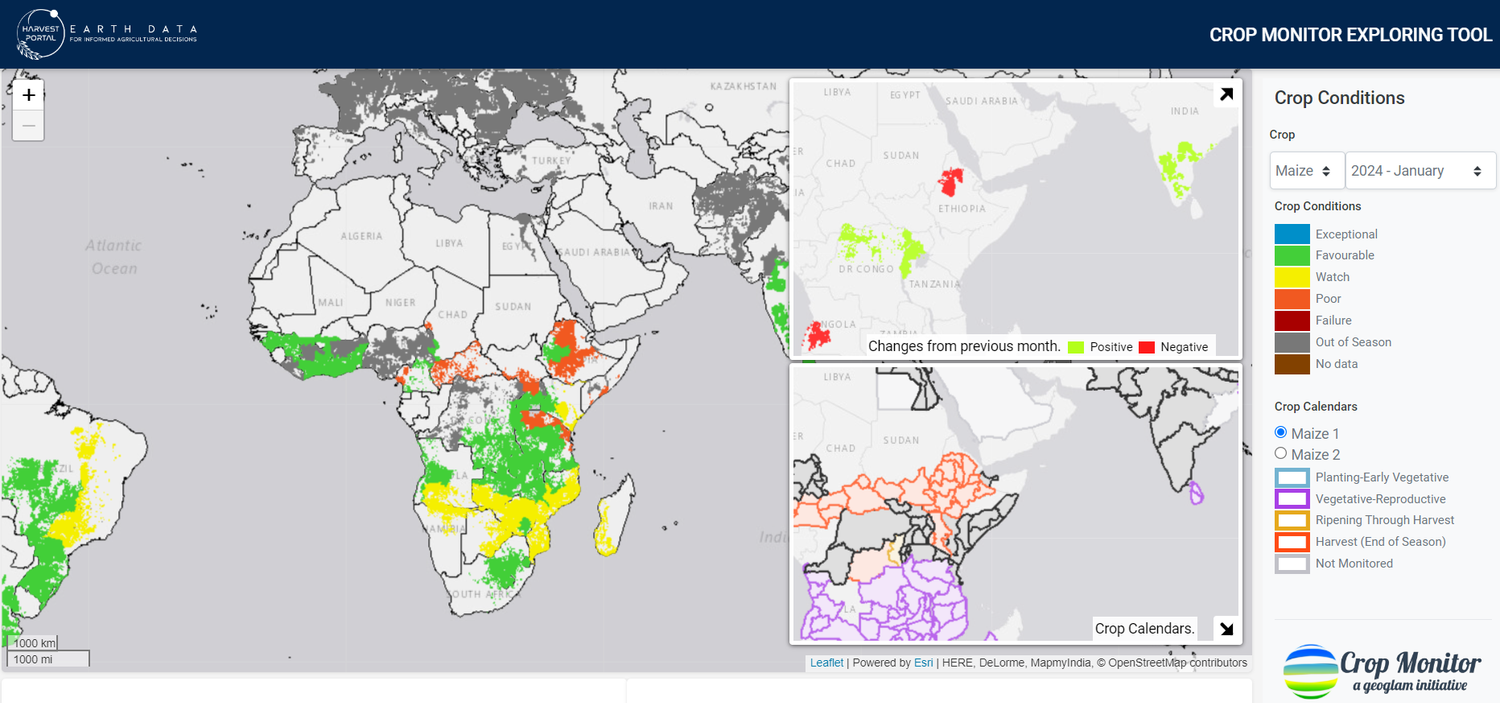
Moreover, the updated CMET depicts current and historical crop condition information in easy-to-interpret pie charts and graphical formats. These visuals represent the current percentage of global production areas projected to achieve near to above-average yields, as well as the proportion anticipated to experience below-normal yields for a specific crop type. The visuals highlight global trends over time, enabling users to track changes and patterns in crop performance worldwide.
The tool also features a pie chart illustrating the percentage of each country's contribution to the total global production of a specific crop. Additionally, it offers a table presenting seasonal crop calendar data for major producing countries. The CMET is a valuable tool for stakeholders such as government agencies, humanitarian aid organizations, research institutions, agribusinesses, and more to make informed decisions regarding the current state of crops and expected yield outcomes at the global, national, and regional scales.

AGMET EO Indicator Tool
The Agrometeorological (AGMET) Earth Observation (EO) Indicators Tool offers detailed insights into crop development and current crop conditions at a sub-national scale through various EO data products. Each plot within the tool presents a comprehensive view of in-season crop conditions using different climate, environmental, and vegetative variables.
The plots feature graphs for Normalized Difference Vegetation Index (NDVI), Evaporative Stress Index (ESI), precipitation, soil moisture, and temperature, each offering insights into crop health and environmental conditions. Components such as 10-year minimum and maximum values, 5-year mean values, and comparisons with previous and current seasons aid analysts in understanding trends and variability over time. Additionally, crop calendars are integrated into the plots, offering reference points for different stages of crop development. Together, these components provide a comprehensive overview of crop conditions throughout the season, offering analysts valuable real-time insights into vegetation health and expectations for seasonal outcomes.

National and Regional Crop Monitors
Building on the global success of the Crop Monitor for Early Warning, GEOGLAM began working with mandated national agencies responsible for food security policy and response programs. The result has been several examples of co-developed Crop Monitors at the national and regional level. These monitors are developed and operated by the countries close to the program and policy decision makers. As a result, the information produced is trusted and deemed authoritative, allowing it to be quickly turned into proactive decisions that impact lives and livelihoods, while reducing the cost of emergency response.
In 2019 a Capacity Development Working Group (CapD WG) was established to share co-development experiences within the community and develop best practices with the objective to accelerate the uptake of national monitoring. The draft terms of reference for the CapD WG can be found here.
Beyond national impact, the national and regional crop monitors play a significant role in improving the quality of the three Crop Monitors reports by supplementing global top-down data flows with bottom-up national level data. The result is better resolution and accuracy due to better in-situ information and expertise input into the monitors.
Examples of national implementation in major producers and food insecure nations can be found here:
ESA-funded Study on Agricultural Early Warning Systems

Climate variability, extreme weather and human-induced calamities increasingly threaten agricultural production worldwide. Numerous global agricultural Early Warning Systems (EWS) exist, yet strong differences in methodology, inputs, outputs, and usability remain. Countries seeking to strengthen national monitoring capacities lack clear guidance on which system best fits their agro-climatic context. At the same time, both specific user needs and Earth Observation-based monitoring capabilities are continuously evolving, calling for tight alignment between the scientific community, EWS providers and main stakeholders.